
.png)
Debugging & developer console
Debug Bellini applications with a developer console built for visual application development. Monitor messages, filter errors, trace issues to components, and troubleshoot runtime behavior from inside the development experience.
Bellini helps developers understand what is happening in the application so they can move from problem to fix faster.

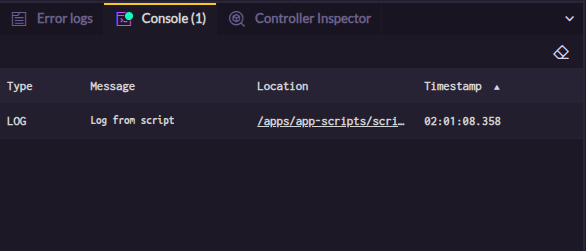
Developer console
Use the Developer Console to inspect application activity while you build and test. Review messages, errors, and runtime information without relying only on the browser console.
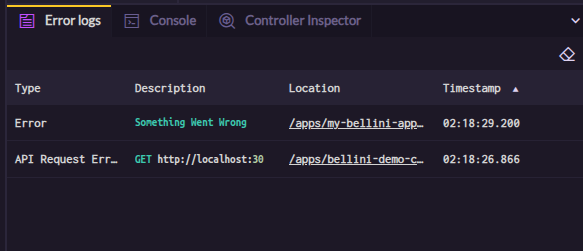
Error filtering
Filter errors to focus on the information that matters. Narrow down issues by component or context so developers can investigate problems more efficiently.

Component-level debugging
Debug issues at the component level. See which component is involved, inspect related messages, and understand how component behavior affects the application.
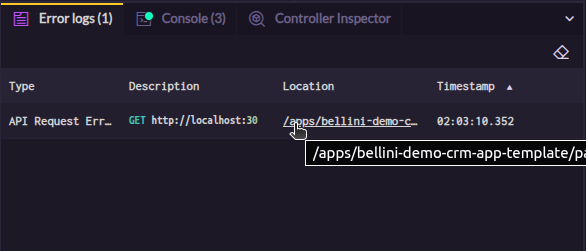
Trace issues to source
Follow errors back to where they started. Bellini helps developers connect runtime issues to the relevant component, function, expression, or configuration.
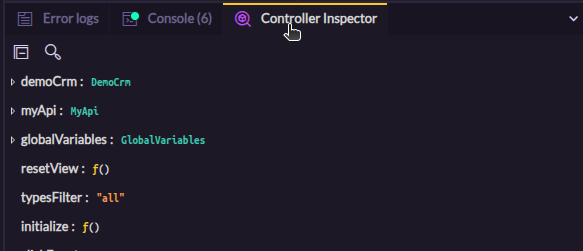
Runtime troubleshooting
Troubleshoot application behavior while it runs. Use runtime information to diagnose data binding issues, component behavior, API interactions, and other problems that appear during testing.